
rOpenSci
we are a group of people who passion is open and reproducible research to everyone, buid it by everyone. And we know how to do it by creating technical and social infrastructure.
- Creating a suite of carefully vetted, federated R software tools.
- Making the right data, tools and best practices more discoverable.
- Welcoming and diverse community.
- Building capacity of software users and developers and fostering a sense of pride in their work.
- Promoting advocacy for a culture of data sharing and reusable software.

Community Manager
Facilitates the activities of a community and the interactions between community members. Community management may be considered as “in-reach” rather than “outreach” or public engagement. - CSCCE

Why analyze our community?
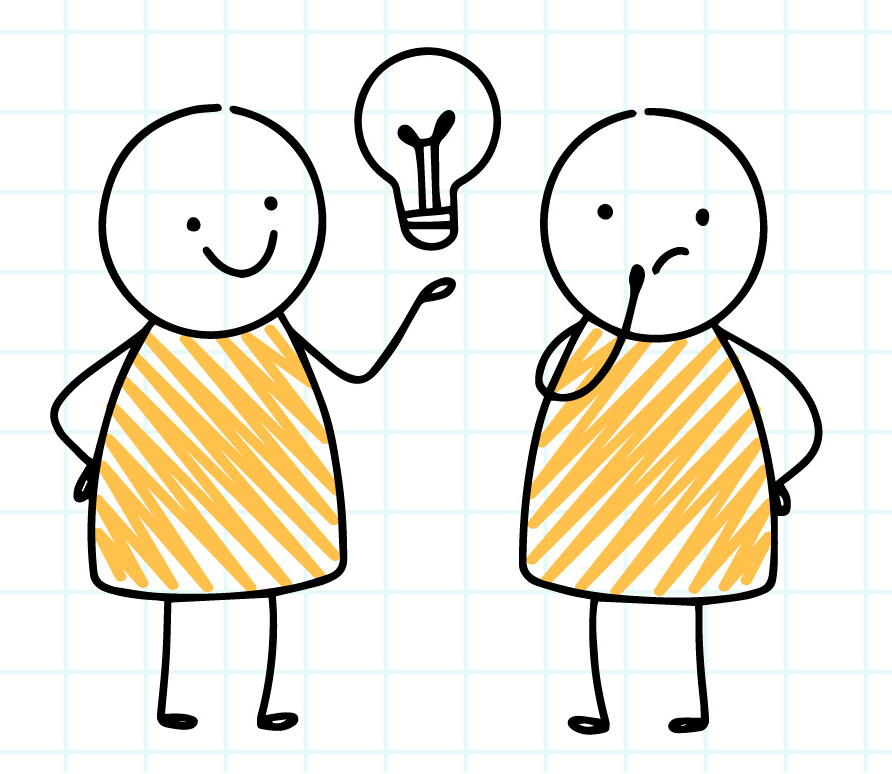
How we can analyze our community connectivity?
Social Networks Analysis - Basic elements

Social Networks Analysis - Basic elements

Social Networks Analysis - Basic elements

Social Networks Analysis - Basic elements

Social Networks Analysis - Basic elements

Social Networks Analysis - Basic elements

Social Networks Analysis - Basic elements

Social Networks Analysis - Basic elements

Social Networks Analysis - Basic elements

How we can collect the data?
Path to contribute at rOpenSci

Write a blog post

Review a package
Maintain a package

Speak at a Comm Call

Become a champion

Host a coworking session
Contributions in a network
N:author. E:coauthorship
N:author, editor, reviewer. E:peer-review
N:developer. E:codevelopment.
N:speaker. E:cospeaking, coorganization
N:mentor, mentee. E:mentorship
N:participants. E: coorganization, coattendence
Data for the network
Webpage
GitHub, database
GitHub,r-universe
Webpage
Webpage, database
Webpage
Let’s see an example with the Blog
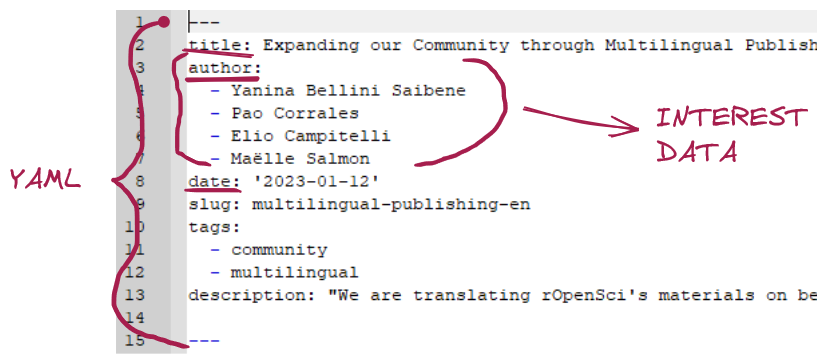
Let’s see an example with the Blog
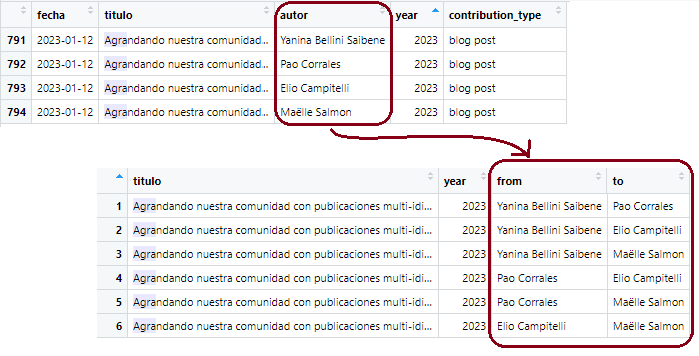
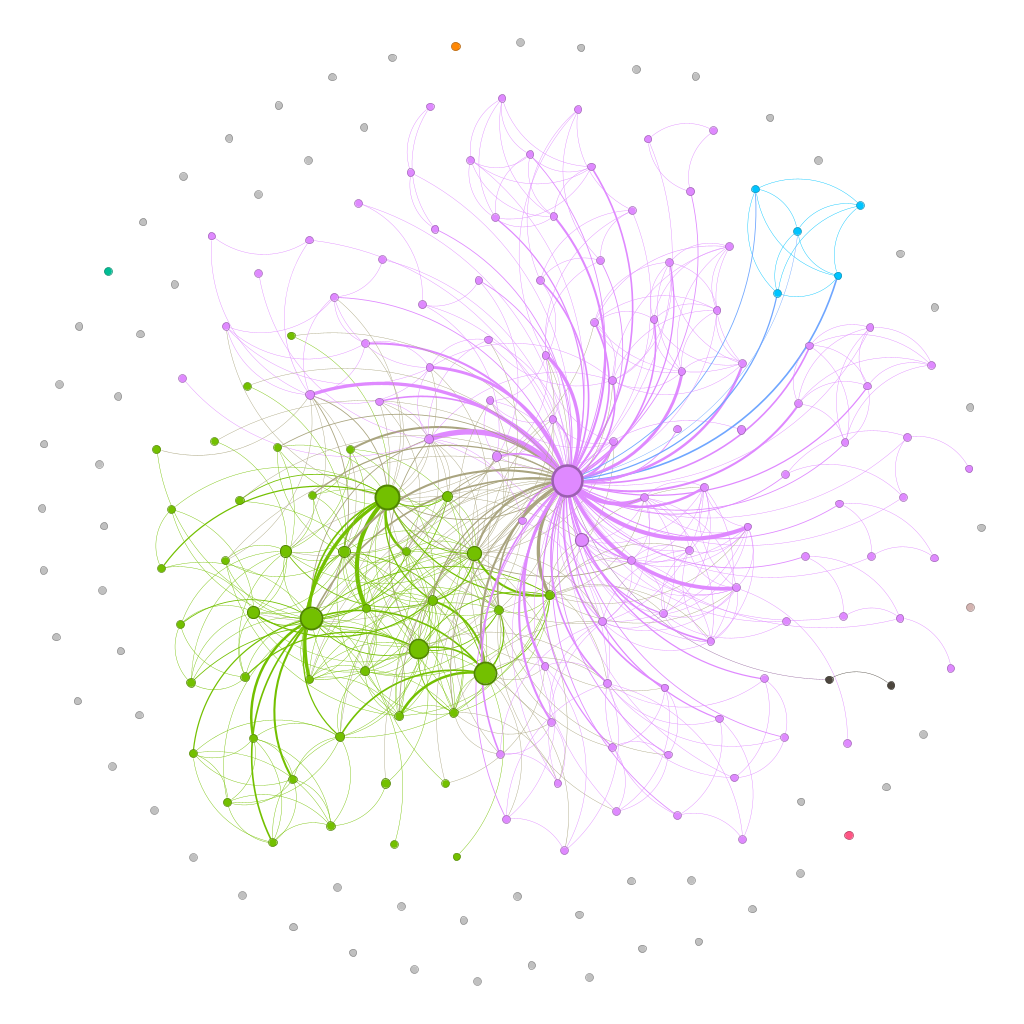
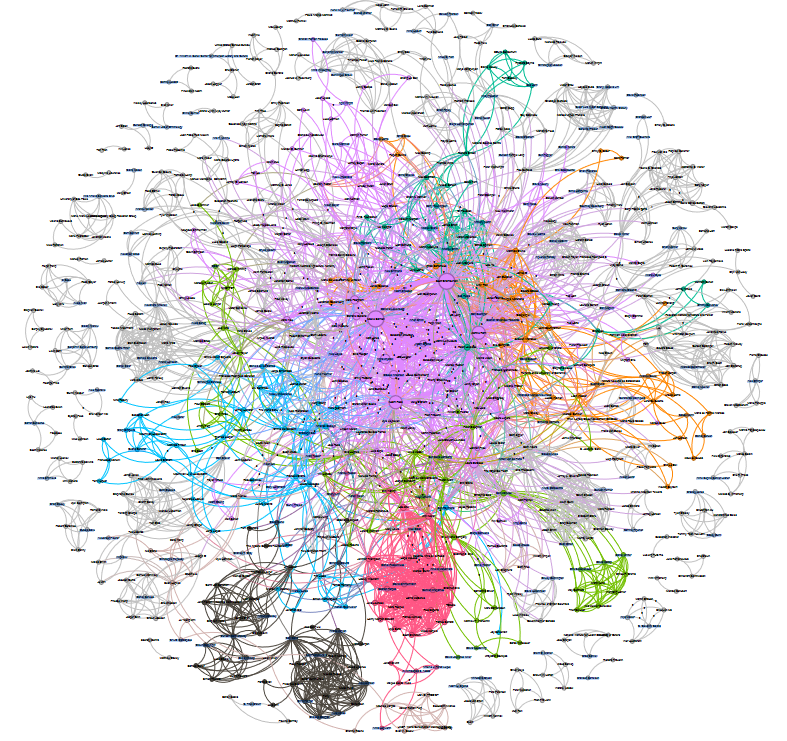
Blog-Post full network 2013-2023
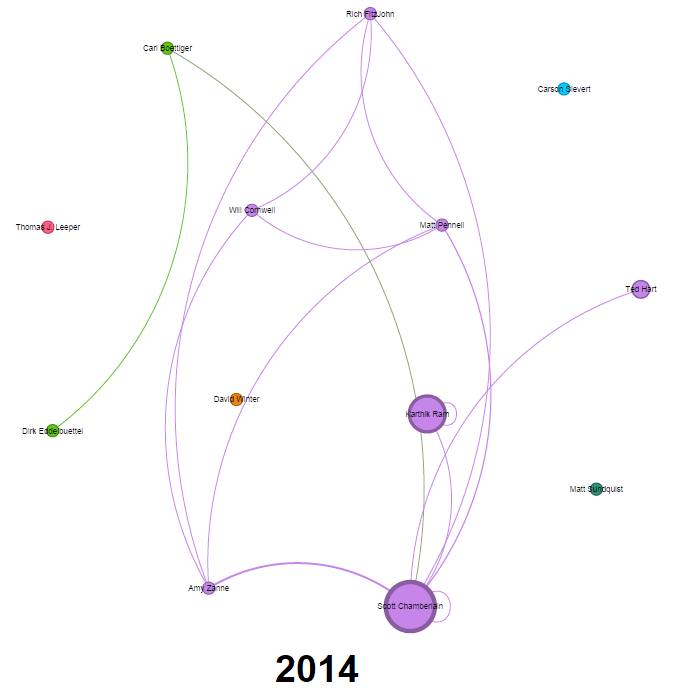
We can analyze it annually
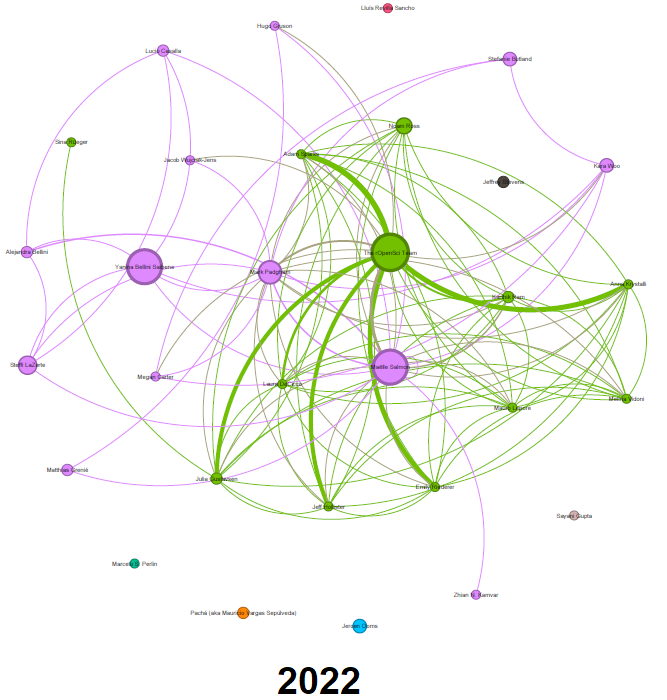
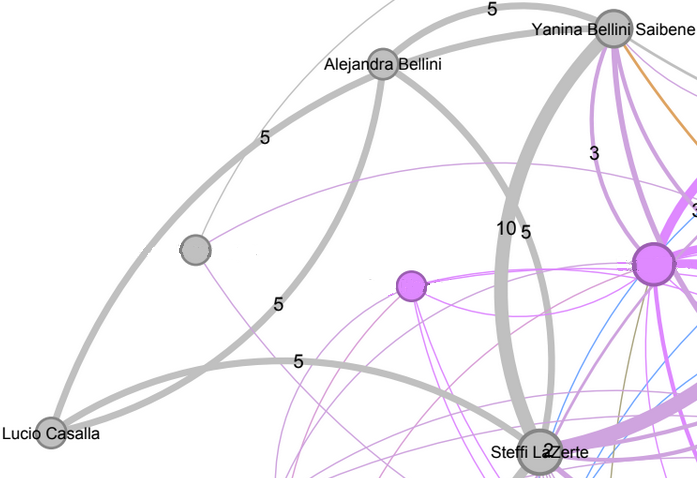
All contribution together
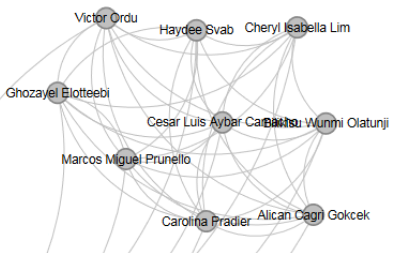 Champions first co-hort
R-universe Stars Interview Team
What if you wanted to do the same for your community?

¡Gracias, Thank you, Obrigada!
- Slides: https://bit.ly/csvconf2023
- GitHub: https://github.com/yabellini/CSVConfv7
- The pictures are adaptation by my 7yo son and me to images by Freepik on hand drawn style stickman set
- We use R, gephy, excalidraw and quarto for build this talk.
- Thanks to the rOpenSci Staff Team, Elio, Ale and my English Conversation Club for their feedback.

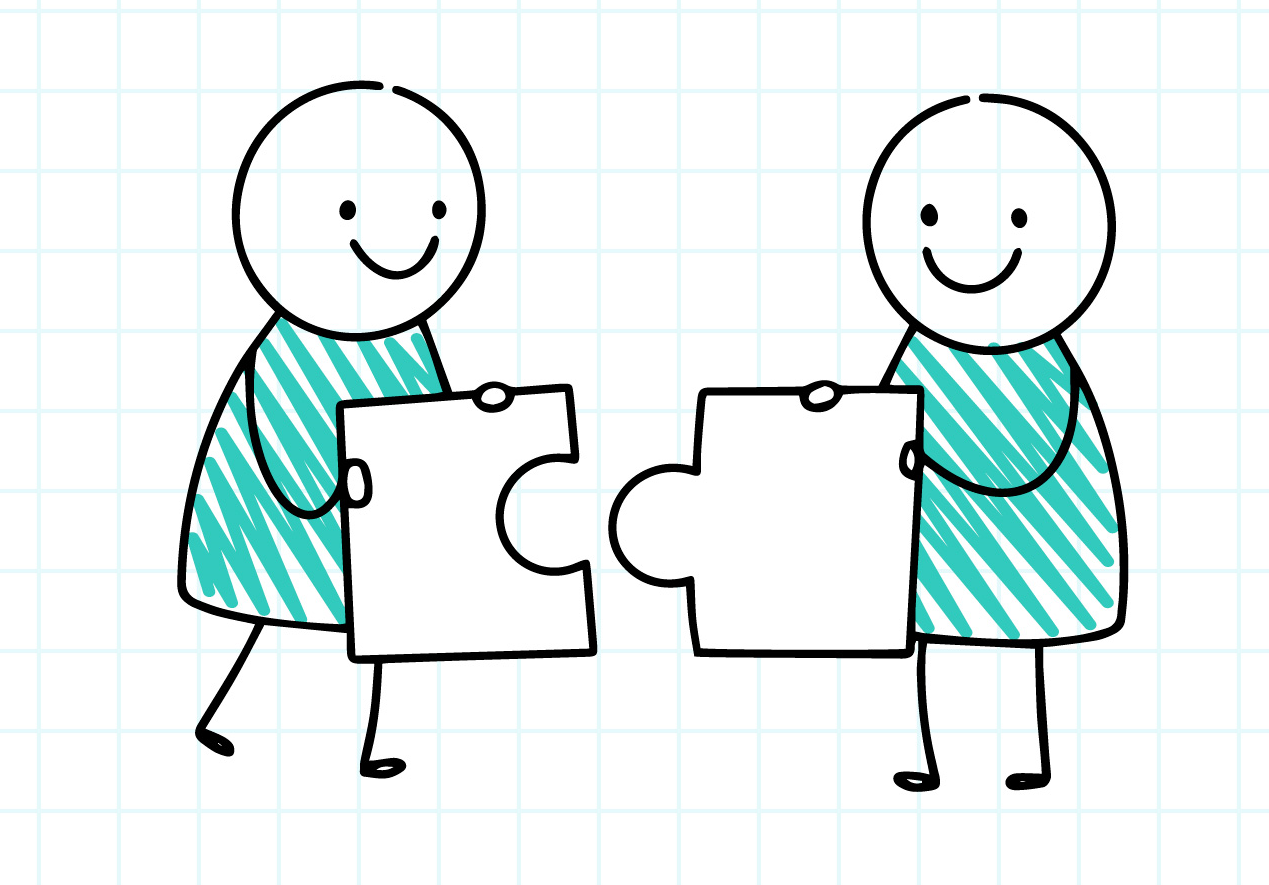
Social Networks Analysis
Group of individuals who relate to others for a specific purpose, characterized by the existence of information flows.